

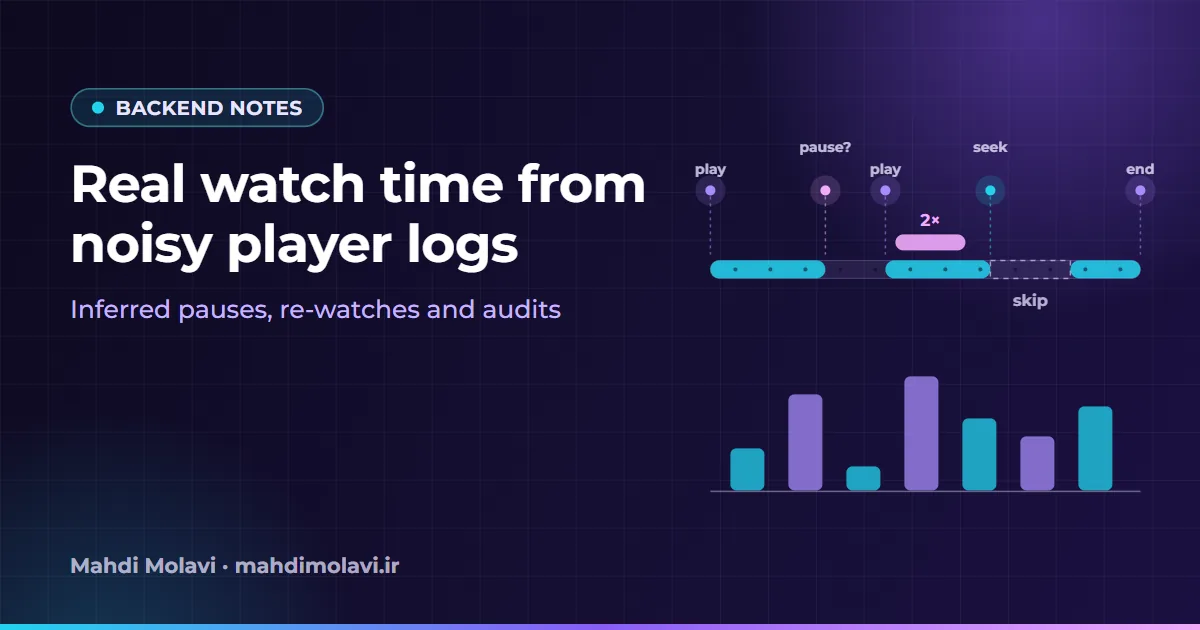
"How much of this video did the student actually watch?" sounds like a question with a one-line answer. The player knows where the playhead is, so add up the seconds. Then you open the raw events and the one-liner falls apart: pauses that were never logged, tabs closed in the middle of a lesson, phones whose clocks are minutes off, people watching at 2x, people dragging the slider back to see a proof for the third time.
For a large Persian-language online learning platform, I rebuilt the pipeline that turns that telemetry into facts people can rely on. For every student and every video it answers: how many distinct seconds were watched, which parts were re-watched or skipped, whether the video was really finished, and how the watching was spread across days. The work started from a 2024 prototype written by two other developers; in 2026 I reworked the ingest service, the analysis engine, the storage model and the tests. This note walks through the decisions that turned out to matter.
What the player sends
The web player posts a small JSON event whenever something happens: play, pause, seek, a change of speed or quality, and a periodic "still playing" heartbeat. Each event carries the position in the video, a client timestamp and identifiers for the learner and the video. The video file itself is never analysed. Everything below is inferred from these events.
Two properties shape the whole design. Events are cheap to send and arrive in large volumes, so ingestion must never slow the player down. And events are unreliable in ways that are normal rather than exceptional, so the analysis has to reason about what probably happened between two events instead of trusting each one.
Ingest: accept fast, write later
The ingest service is an ASP.NET Core minimal API on .NET 10. Its request path does almost nothing: it puts the event on a bounded in-memory channel and returns 202 Accepted. When the channel is full it answers 503 with a problem-details body, so clients back off instead of the server falling over. A simplified version of the endpoint:
app.MapPost("/events", (PlayerEvent e, EventBuffer buffer) =>
    buffer.TryEnqueue(e)
        ? Results.Accepted()
        : Results.Problem(title: "The event buffer is full.",
                          statusCode: StatusCodes.Status503ServiceUnavailable));
A background worker drains the channel and flushes when a batch is full or when a timer fires, whichever comes first. Each flush loads the batch into temporary tables and applies one set-based upsert inside a single transaction, so SQL Server performs a few large operations instead of thousands of small ones.
The detail I would repeat in any similar system is how a failing batch is handled. If SQL Server rejects a batch with a data error (a constraint violation, a value that is too long, a failed conversion), the worker retries that batch row by row, writes the rows that still fail to an error table and moves on. One malformed event cannot block the thousands of good ones queued behind it. Infrastructure errors are treated differently: the batch stays in the buffer and is retried later, because the data was fine and the database was not.
The trade-off is deliberate and written down: an in-memory buffer loses whatever it holds if the process crashes. For behavioural telemetry that is an acceptable price for a request path measured in milliseconds. For payments it would not be. A separate watchdog alerts the team when no events have arrived for longer than expected, which catches a broken player release faster than any dashboard.
In a Locust benchmark on a 12-core workstation, replaying 10,000 events with 50 concurrent users, every request was accepted with no failures, at about 2,450 requests per second, a median latency of 13 ms and a 95th percentile of 21 ms. The service peaked at about 108 MB of memory.
From events to watched seconds
The analysis engine is plain C# with no dependencies, which made it easy to test thoroughly. For each (learner, video) pair it reads the full event history in time order and rebuilds the playback sessions. Four rules do most of the work.
1. Progress has to be physically possible
Between two consecutive events the playhead moved some number of video seconds while some number of wall-clock seconds passed. If the video advanced further than the fastest allowed playback speed (2x) could explain, that segment is not counted as watched; something else happened, usually a seek that was logged late or not at all. Segments with no forward progress, or longer than the video itself, are rejected for the same reason.
static bool IsPlausible(double videoSeconds, TimeSpan wallClock,
                        double videoLength, double maxSpeed = 2.0) =>
    videoSeconds > 0
    && videoSeconds <= videoLength
    && videoSeconds <= maxSpeed * wallClock.TotalSeconds;
2. Count tenths, not seconds
Coverage is tracked at a resolution of 0.1 seconds, with half-open intervals so that two adjacent segments never count their shared boundary twice. A video second counts as watched only when at least half of its ten tenths were covered. This avoids two opposite errors: crediting a whole second to a seek that landed at 12.9, and losing a second that was watched in two short pieces.
3. Infer the pauses nobody logged
While a video plays, the player sends a heartbeat at a regular interval. That makes silence informative. If much more time has passed since the last event than playback at the slowest allowed speed could explain, plus a tolerance, the learner almost certainly stopped watching without a pause event reaching the server: a closed tab, a lost connection, a closed laptop. Instead of crediting the whole gap, the engine inserts a virtual pause at the last position it can trust.
The same reconstruction covers the other everyday cases. A seek resumes playback at its target position. A settings change cannot reopen a session that was already closed. A session still open at the end of the history is closed at its last known position.
4. A re-watch has to look like a re-watch
Seconds watched more than once interest teachers, because they point at the hard parts of a lesson. But a learner who scrubs back two seconds to catch a word has not re-watched anything. The engine reports a repeated range only when every second in it was watched at least twice and the run lasts at least four seconds, tolerating a one-second hole inside the run. Skipped ranges come from the same timeline, read in the other direction.
Time is harder than it looks
Two smaller decisions removed whole classes of strange results. The first is about client clocks: an event's own timestamp is used only when it is within 30 minutes of the moment the server received it; otherwise the server time wins. A phone set to the wrong day can no longer push someone's studying into next month.
The second is midnight. Per-day coverage matters for learning analytics ("did they study a bit every day?"), so a segment that crosses midnight is split. Progress is assumed to be uniform within the segment, and each video second is attributed to the day that contains its midpoint. The date dimension also carries Persian calendar fields, because the people reading the reports think in Persian months.
Storing the results
Results go into a small star schema in SQL Server: date and video dimensions, plus fact tables for per-pair watching, daily coverage, per-second actions, skipped ranges and repeated seconds. Batches are written with SqlBulkCopy, on a connection that deliberately runs with Multiple Active Result Sets turned off; large asynchronous bulk copies and MARS on one connection are a combination best avoided.
Recomputation is idempotent by design. When new events arrive for a pair, the engine recomputes that pair's entire history and writes a fresh snapshot tagged with the job that produced it, then deletes the older snapshots of the same pairs. Rerunning a job, or running two that overlap, converges to the same state instead of counting anything twice. Jobs themselves are rows in a queue table with a watermark over the event log, so new events are processed incrementally and an interrupted run can resume where it stopped.
Testing an engine whose answers you do not know
The hard part of testing this kind of engine is the oracle: for a messy history, what is the right answer? I settled on working out the expected values for each test history independently, before running the engine on it, and only then comparing. The suite grew to 282 passing tests: histories chosen to hit specific patterns (gaps, seeks, heartbeats, midnight, speed changes), randomly sampled histories, and small hand-built scenarios for each rule above.
On top of the unit tests sits an audit. A separate implementation of the same rules, written in Python, reads the raw events for a random sample of pairs, recomputes all five fact tables and compares them with what the C# pipeline stored. In the latest audit every sampled pair matched in every table. Two implementations in different languages agreeing on messy data is a much stronger signal than either one passing its own tests.
What I would change next
- The analysis processes pairs one after another in a single loop. That is simple and correct, but the work is embarrassingly parallel, and partitioning pairs across workers is the obvious next step.
- Result objects are converted to
DataTables forSqlBulkCopythrough reflection. A typedIDataReaderwould cut allocations on large batches. - The ingest buffer and the inactivity watchdog are single-instance by design. That is fine at the current scale and the first thing to revisit if the service ever runs on more than one node.
If you are measuring engagement from player telemetry and want a second pair of eyes on the rules or the pipeline, this is the kind of backend and data work I take on: see Work with me.
This note is also available in Persian: read the Persian version.